
Where we invest

Four Sun Belt markets, one investment thesis.

We don't chase deals across 50 states.

Contact us
Market overview

Why these markets. Each one passes the same three tests, and we check them again every year.

Population growth
Job diversity
Rent over supply
All markets

Our markets, and the numbers behind each one.

01Southwest & Central

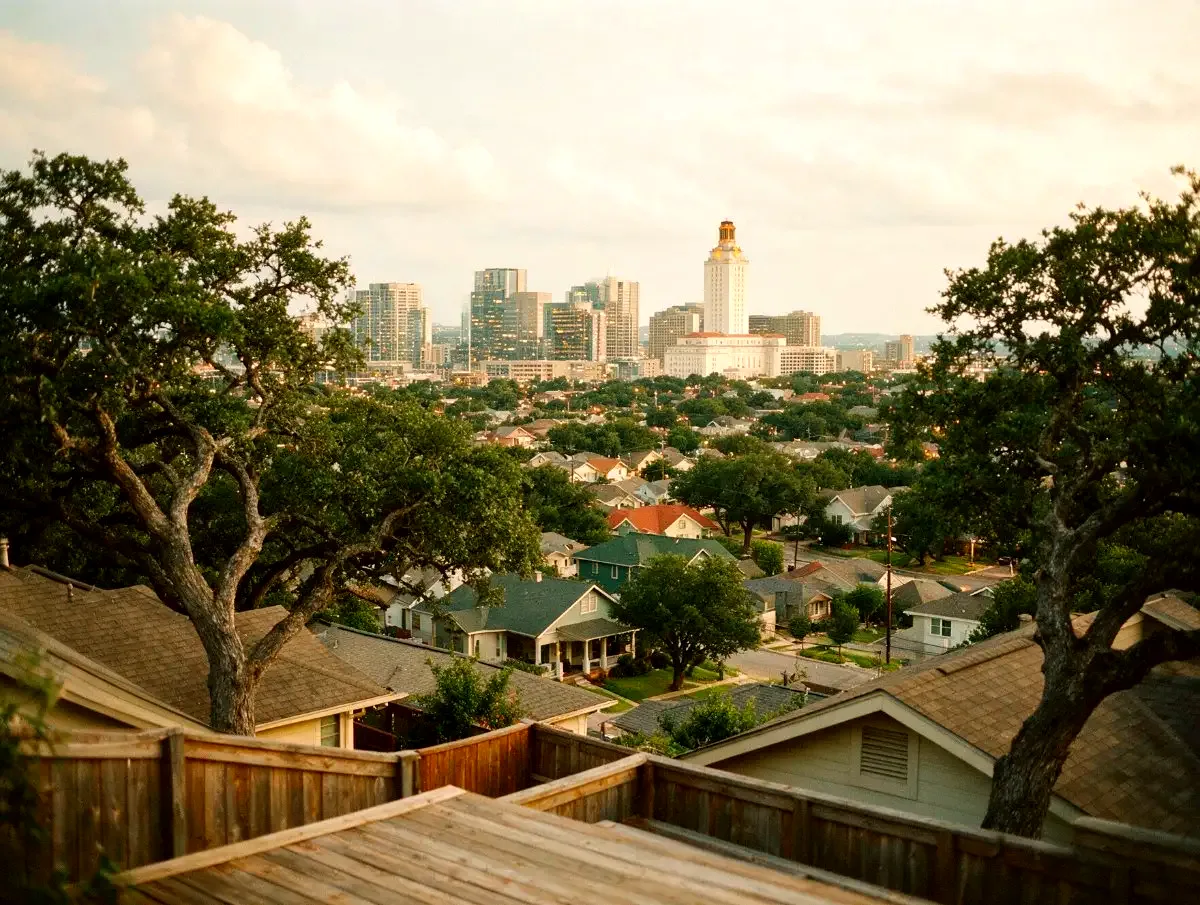
Austin, TX

Population growth +21% (2018–2024)
Deals Closed5
Avg. Cap Rate5.6%
Occupancy94.2%

Texas's fastest-growing metro. Diversified economy — tech, healthcare, education — with multifamily demand outpacing new construction starts since 2021.


02Southeast

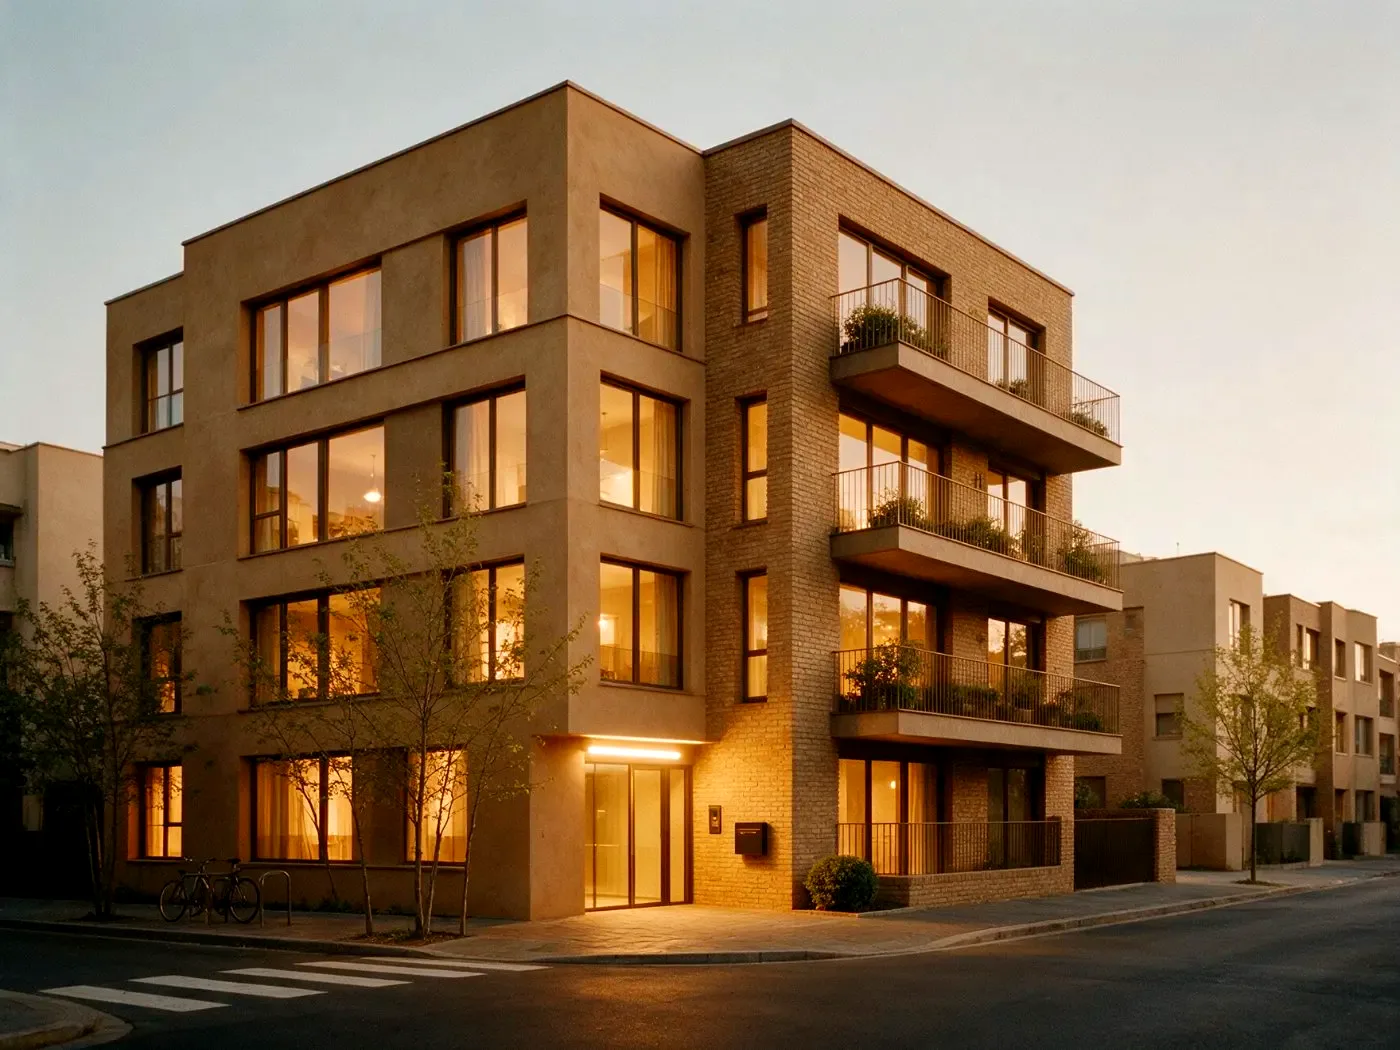
Nashville, TN

Population growth +19% (2018–2024)
Deals Closed4
Avg. Cap Rate5.4%
Occupancy95.1%

Healthcare and music industry anchor a diversified job base. Consistent rent growth with limited rent-control risk at the state level.

03Southwest & Central

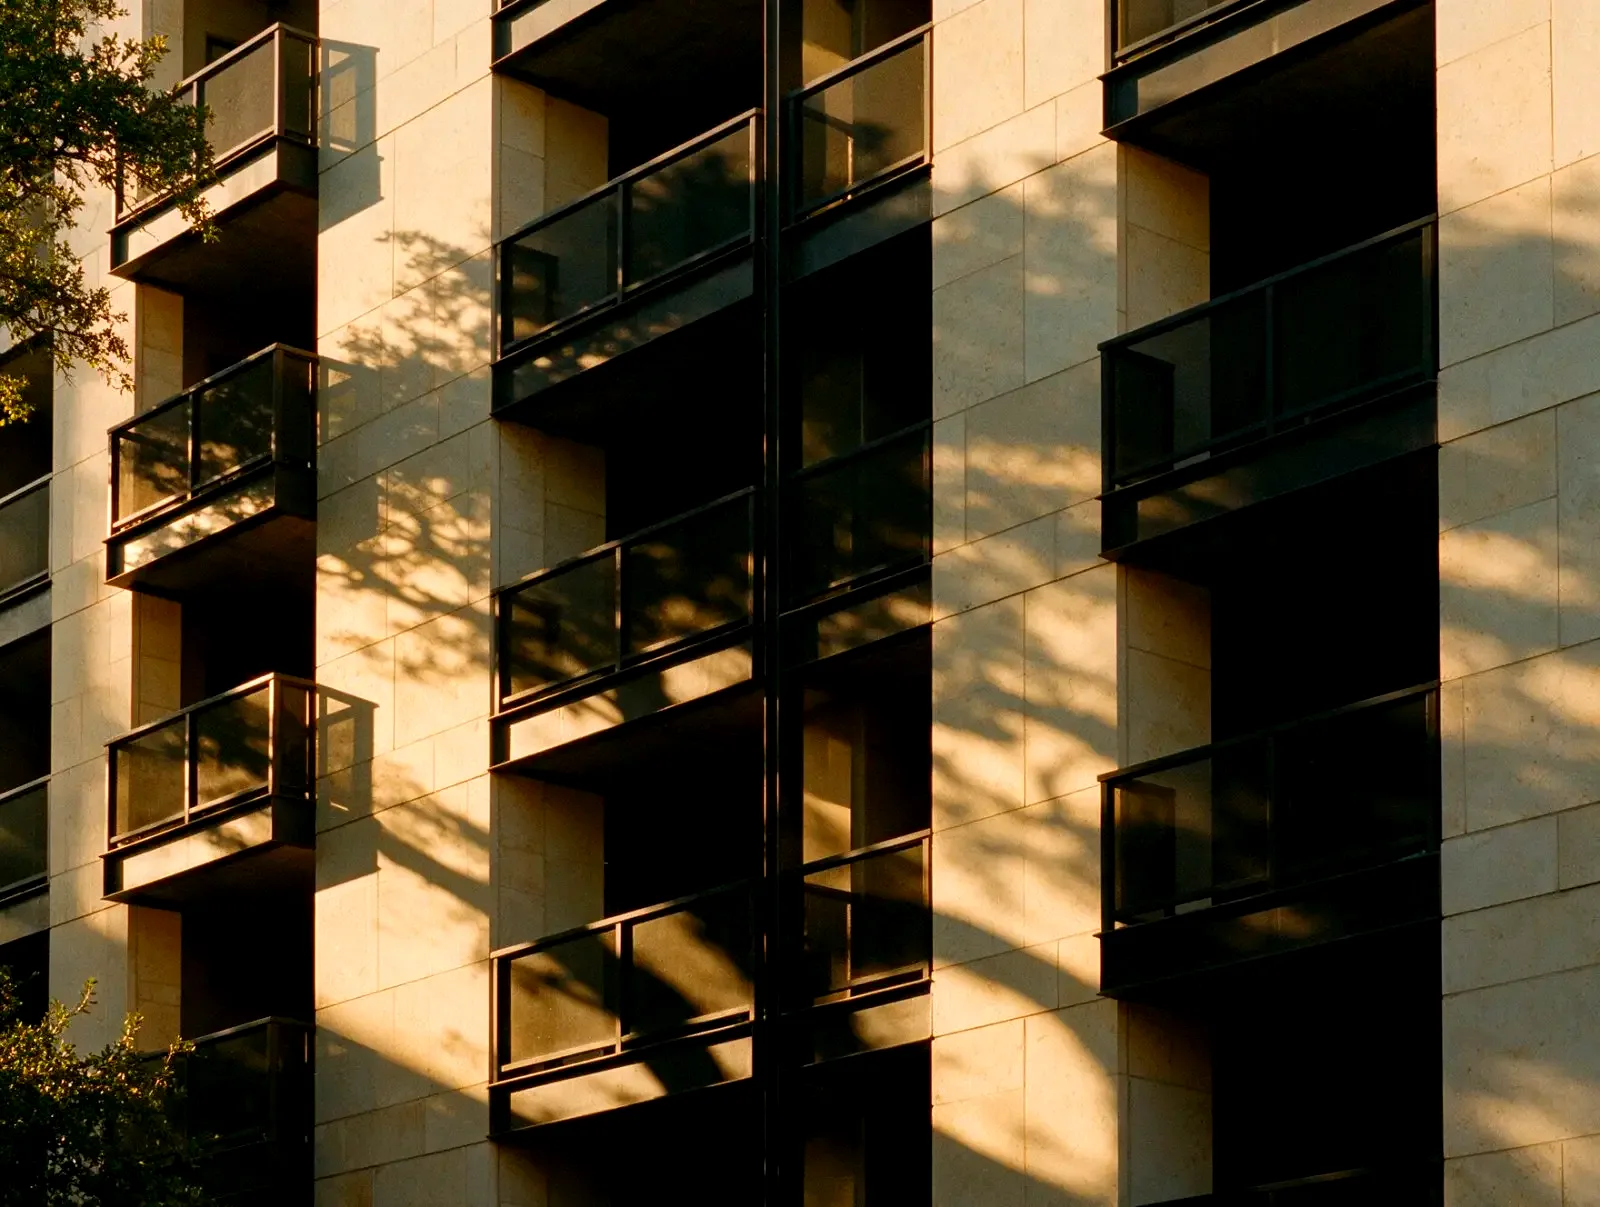
Indianapolis, IN

Population growth +12% (2018–2024)
Deals Closed3
Avg. Cap Rate6.1%
Occupancy93.8%

Lower entry price per unit than coastal markets. Logistics and pharmaceutical employment base provides recession resistance.

04Southwest & Central

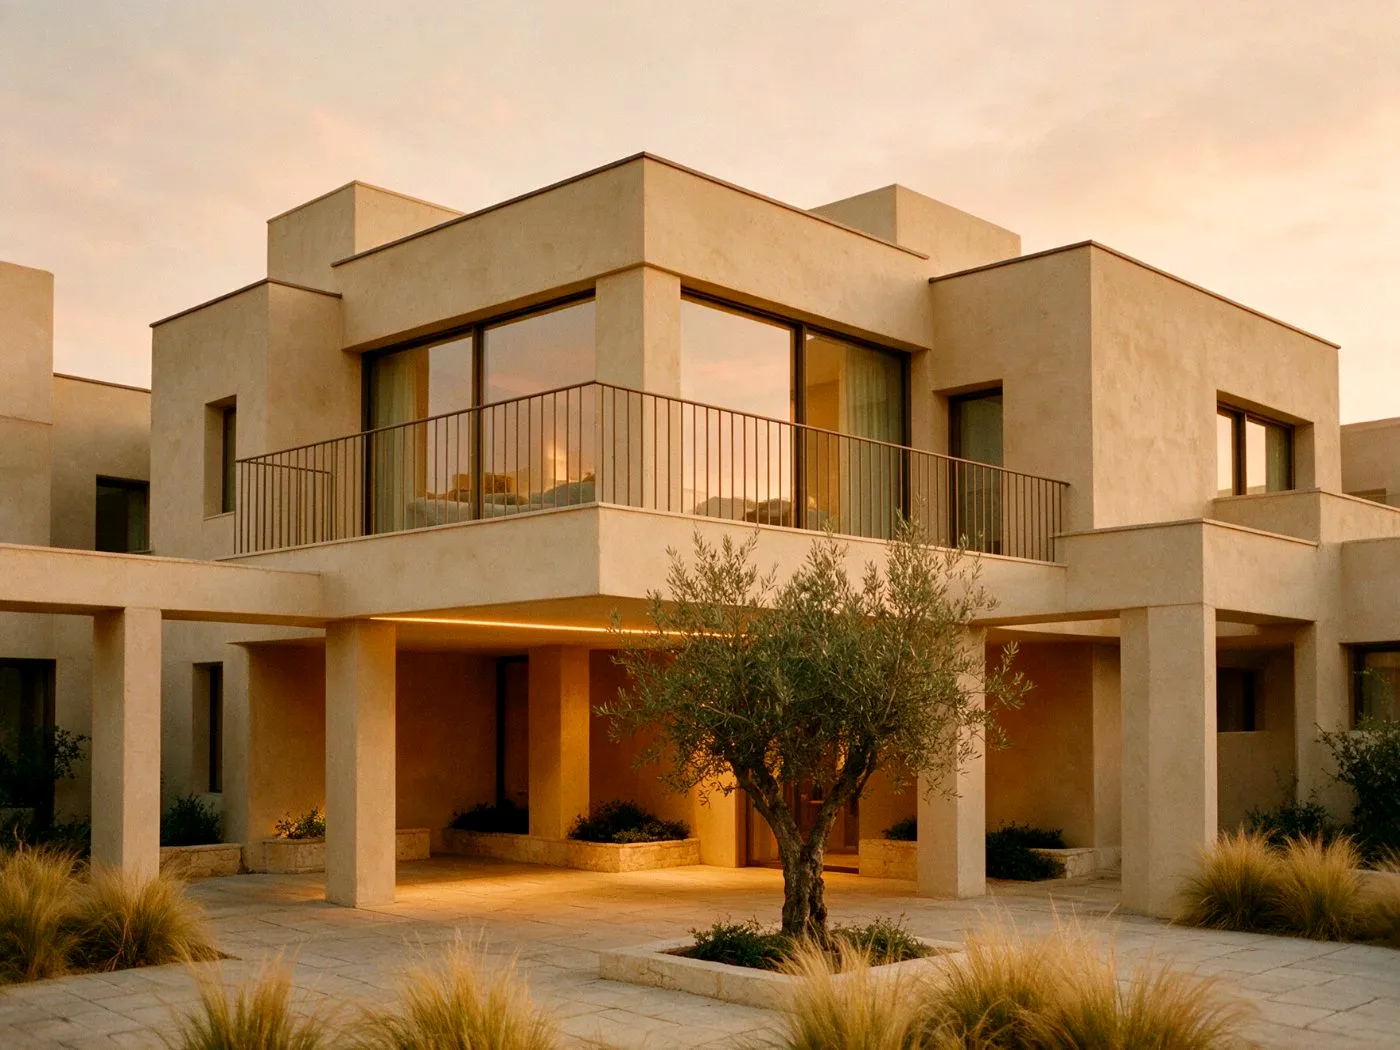
Phoenix, AZ

Population growth +24% (2018–2024)
Deals Closed2
Avg. Cap Rate5.8%
Occupancy94.5%

Fastest population growth in our portfolio. Semiconductor and EV manufacturing investments expanding the employment base beyond traditional construction and services.

By region

Our markets sit in two regions of the Sun Belt. Each region is underwritten on the same three criteria and reviewed again every year.

Region 01 · 1 market

Southeast

4 deals closed
Nashville, TN
Region 02 · 3 markets

Southwest & Central

10 deals closed
Austin, TXIndianapolis, INPhoenix, AZ
Watchlist · 4 metros

Under review

No deals yet
Atlanta, GACharlotte, NCDallas, TXDenver, CO
Comparison

Market comparison, on the same five measures.

Five measuresReviewed every January
Austin, TX01
Nashville, TN02
Indianapolis, IN03
Phoenix, AZ04
Population growth2018–2024
+21%
+19%
+12%
+24%
Rent growthYearly average
+9.1%
+8.4%
+6.8%
+8.5%
Cap ratePortfolio average
5.6%
5.4%
6.1%
5.8%
Deals closedSince 2016
5
4
3
2
OccupancyPortfolio average
94.2%
95.1%
93.8%
94.5%
The darker bar marks the highest figure in each row.Sources: U.S. Census Bureau, CoStar and Jivnani portfolio data.

Austin, TX

01
Population Growth
+21%
Avg. Rent Growth
+9.1%
Avg. Cap Rate
5.6%
Deals Closed
5
Avg. Occupancy
94.2%

Nashville, TN

02
Population Growth
+19%
Avg. Rent Growth
+8.4%
Avg. Cap Rate
5.4%
Deals Closed
4
Avg. Occupancy
95.1%

Indianapolis, IN

03
Population Growth
+12%
Avg. Rent Growth
+6.8%
Avg. Cap Rate
6.1%
Deals Closed
3
Avg. Occupancy
93.8%

Phoenix, AZ

04
Population Growth
+24%
Avg. Rent Growth
+8.5%
Avg. Cap Rate
5.8%
Deals Closed
2
Avg. Occupancy
94.5%
Current offerings

Open for investment right now.

Properties open for investment right now. Select one to see its full terms, projections and timeline.

Investor access

Ready to review the numbers?

Request access to our investor portal — full track record, current offerings, and detailed offering memorandums.